User Story Mapping
Introduction
In 2019 I started at Medici Land Governance (MLG) as a Sr. Product Designer eventually transitioning to Head of Design. I led the design of a 0 to 1 cadaster system.
The Company & Team
At MLG, a company leveraging blockchain for land rights, I collaborated with a diverse team including GIS Engineers and Blockchain Developers, focusing on the Landum product for land administration.
The (early) team
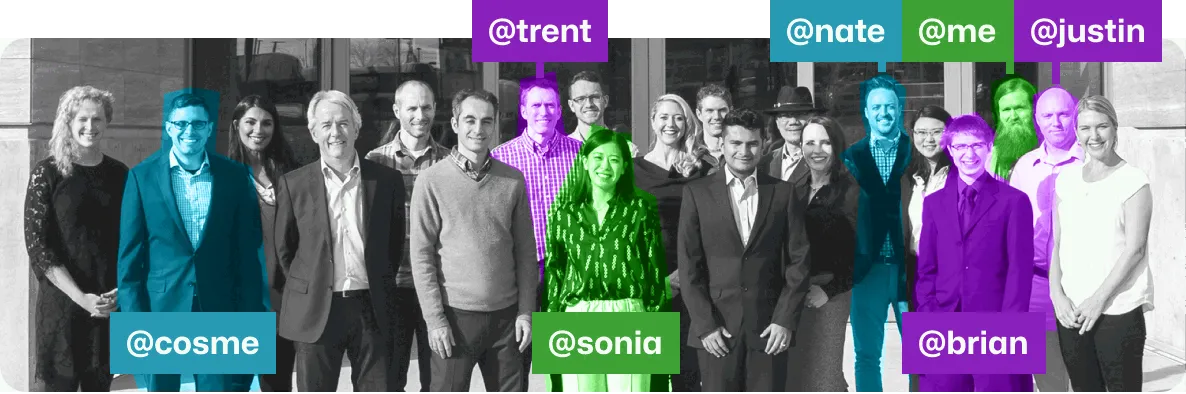
Team details + LinkedIn
- Cosme Salazar Head of Product Management
- Trent Larsen Senior Manager of Development
- Sonia Yang Head of Product Design
- Nate Olson Sr. Product Manager
- Brian Wernick Sr. Software Engineer
- Me 👋 Sr. Product Designer & Facilitator
- Justin Howard Software Development Lead
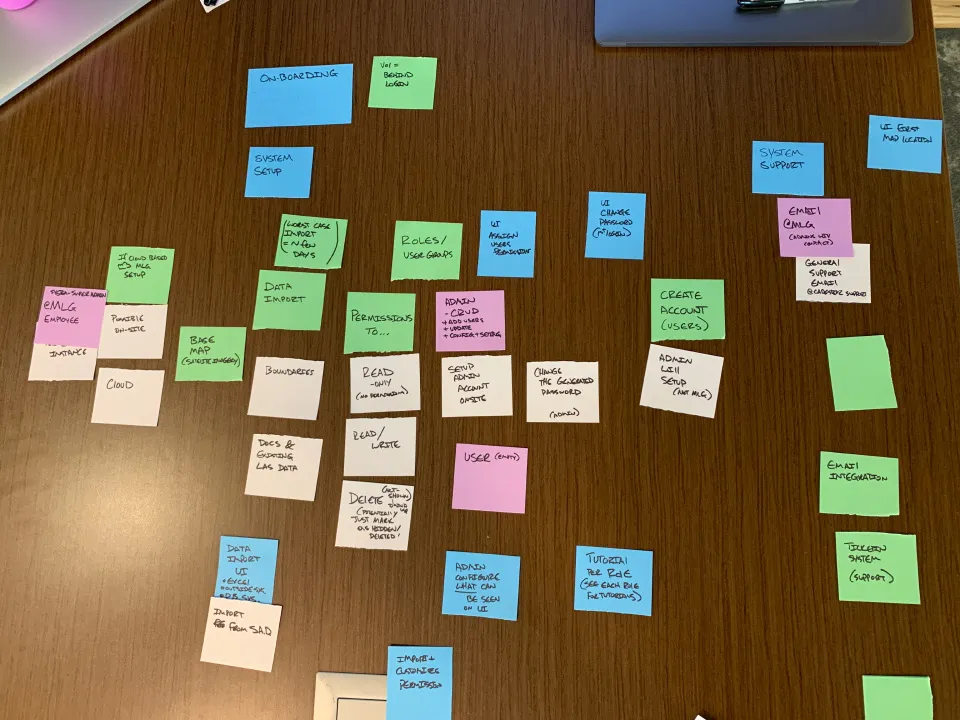
Note on capturing sketches
There's a couple 'capture' habits I believe help build confidence with people entrusting you with early ideas & sketches (if someone takes the time to make a sketch and you lose it, they probably won't make another).-
If someone sends you something, immediately save it somewhere accessible
& visible.
- I'll have a running 'notes' page in Figma that holds any sketches, whiteboard ideas, important Slack messages, etc., for keeping context
- Date things (I have a text-expander snippet for Today's date in YYYYMMDD format that I'll use to label frames + layer in Figma. When in date-format doubt, ISO 8601 it out.
Note about Sonia:
Sonia had been single-handedly doing all design work, this includes branding, product work, business cards, anything with 'design' associated with it, for over a year before I joined. I'd move into her role after she left, and it gave me a really deep appreciation for how much she was shielding me from. The only way I was able to have so much focus on such a wide scope was because of her.🙏Note about Nate:
Before I joined MLG, I had a couple quick meetings with Nate. I’d worked with Sonia before at Overstock, but the PM/UX relationship is critical. This would be for a new product and I was excited to solve an interesting problem, but knew that it was in a very early stage. Nate is a great PM because he is a great communicator and I felt good jumping into the unknown. We were able to work closely and navigate through a lot of ambiguity by having a high-trust relationship. He’s one of not only the best ‘PM’s I’ve gotten to work with, but all-round great dude.Not pictured here is the team in Ireland 🇮🇪, who were incredible. I'd end up collaborating closely with Richard van Hees, and it's a UX/DEV relationship that was high-trust from the beginning.
Design is a dialogue, and those conversations were easy to have with this team.
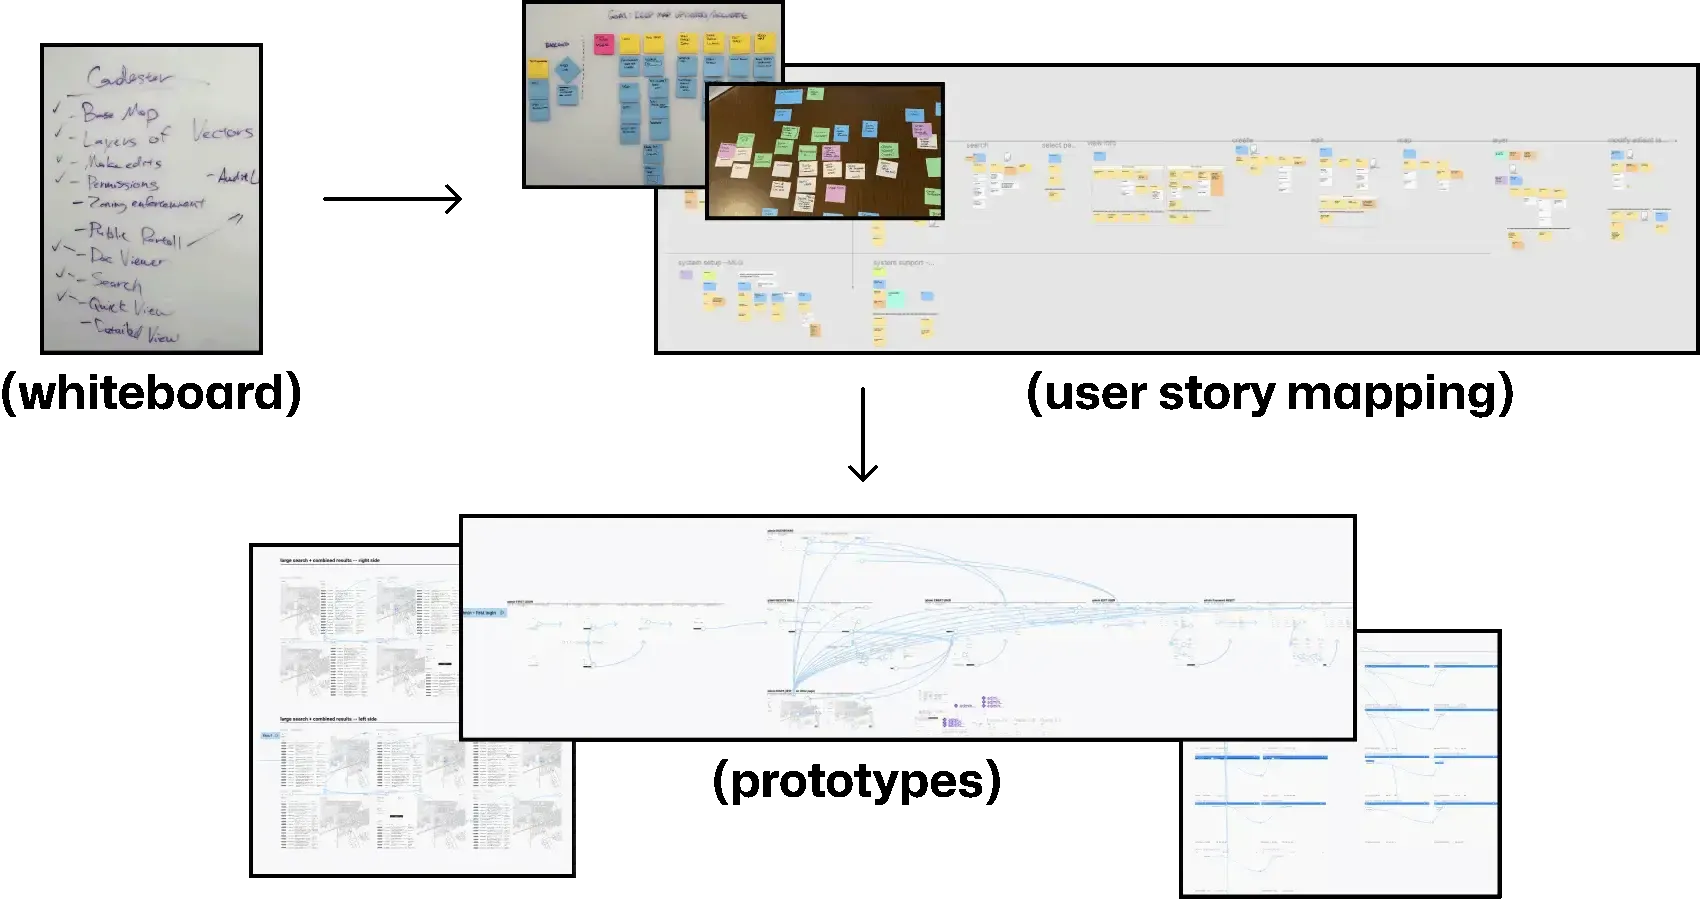
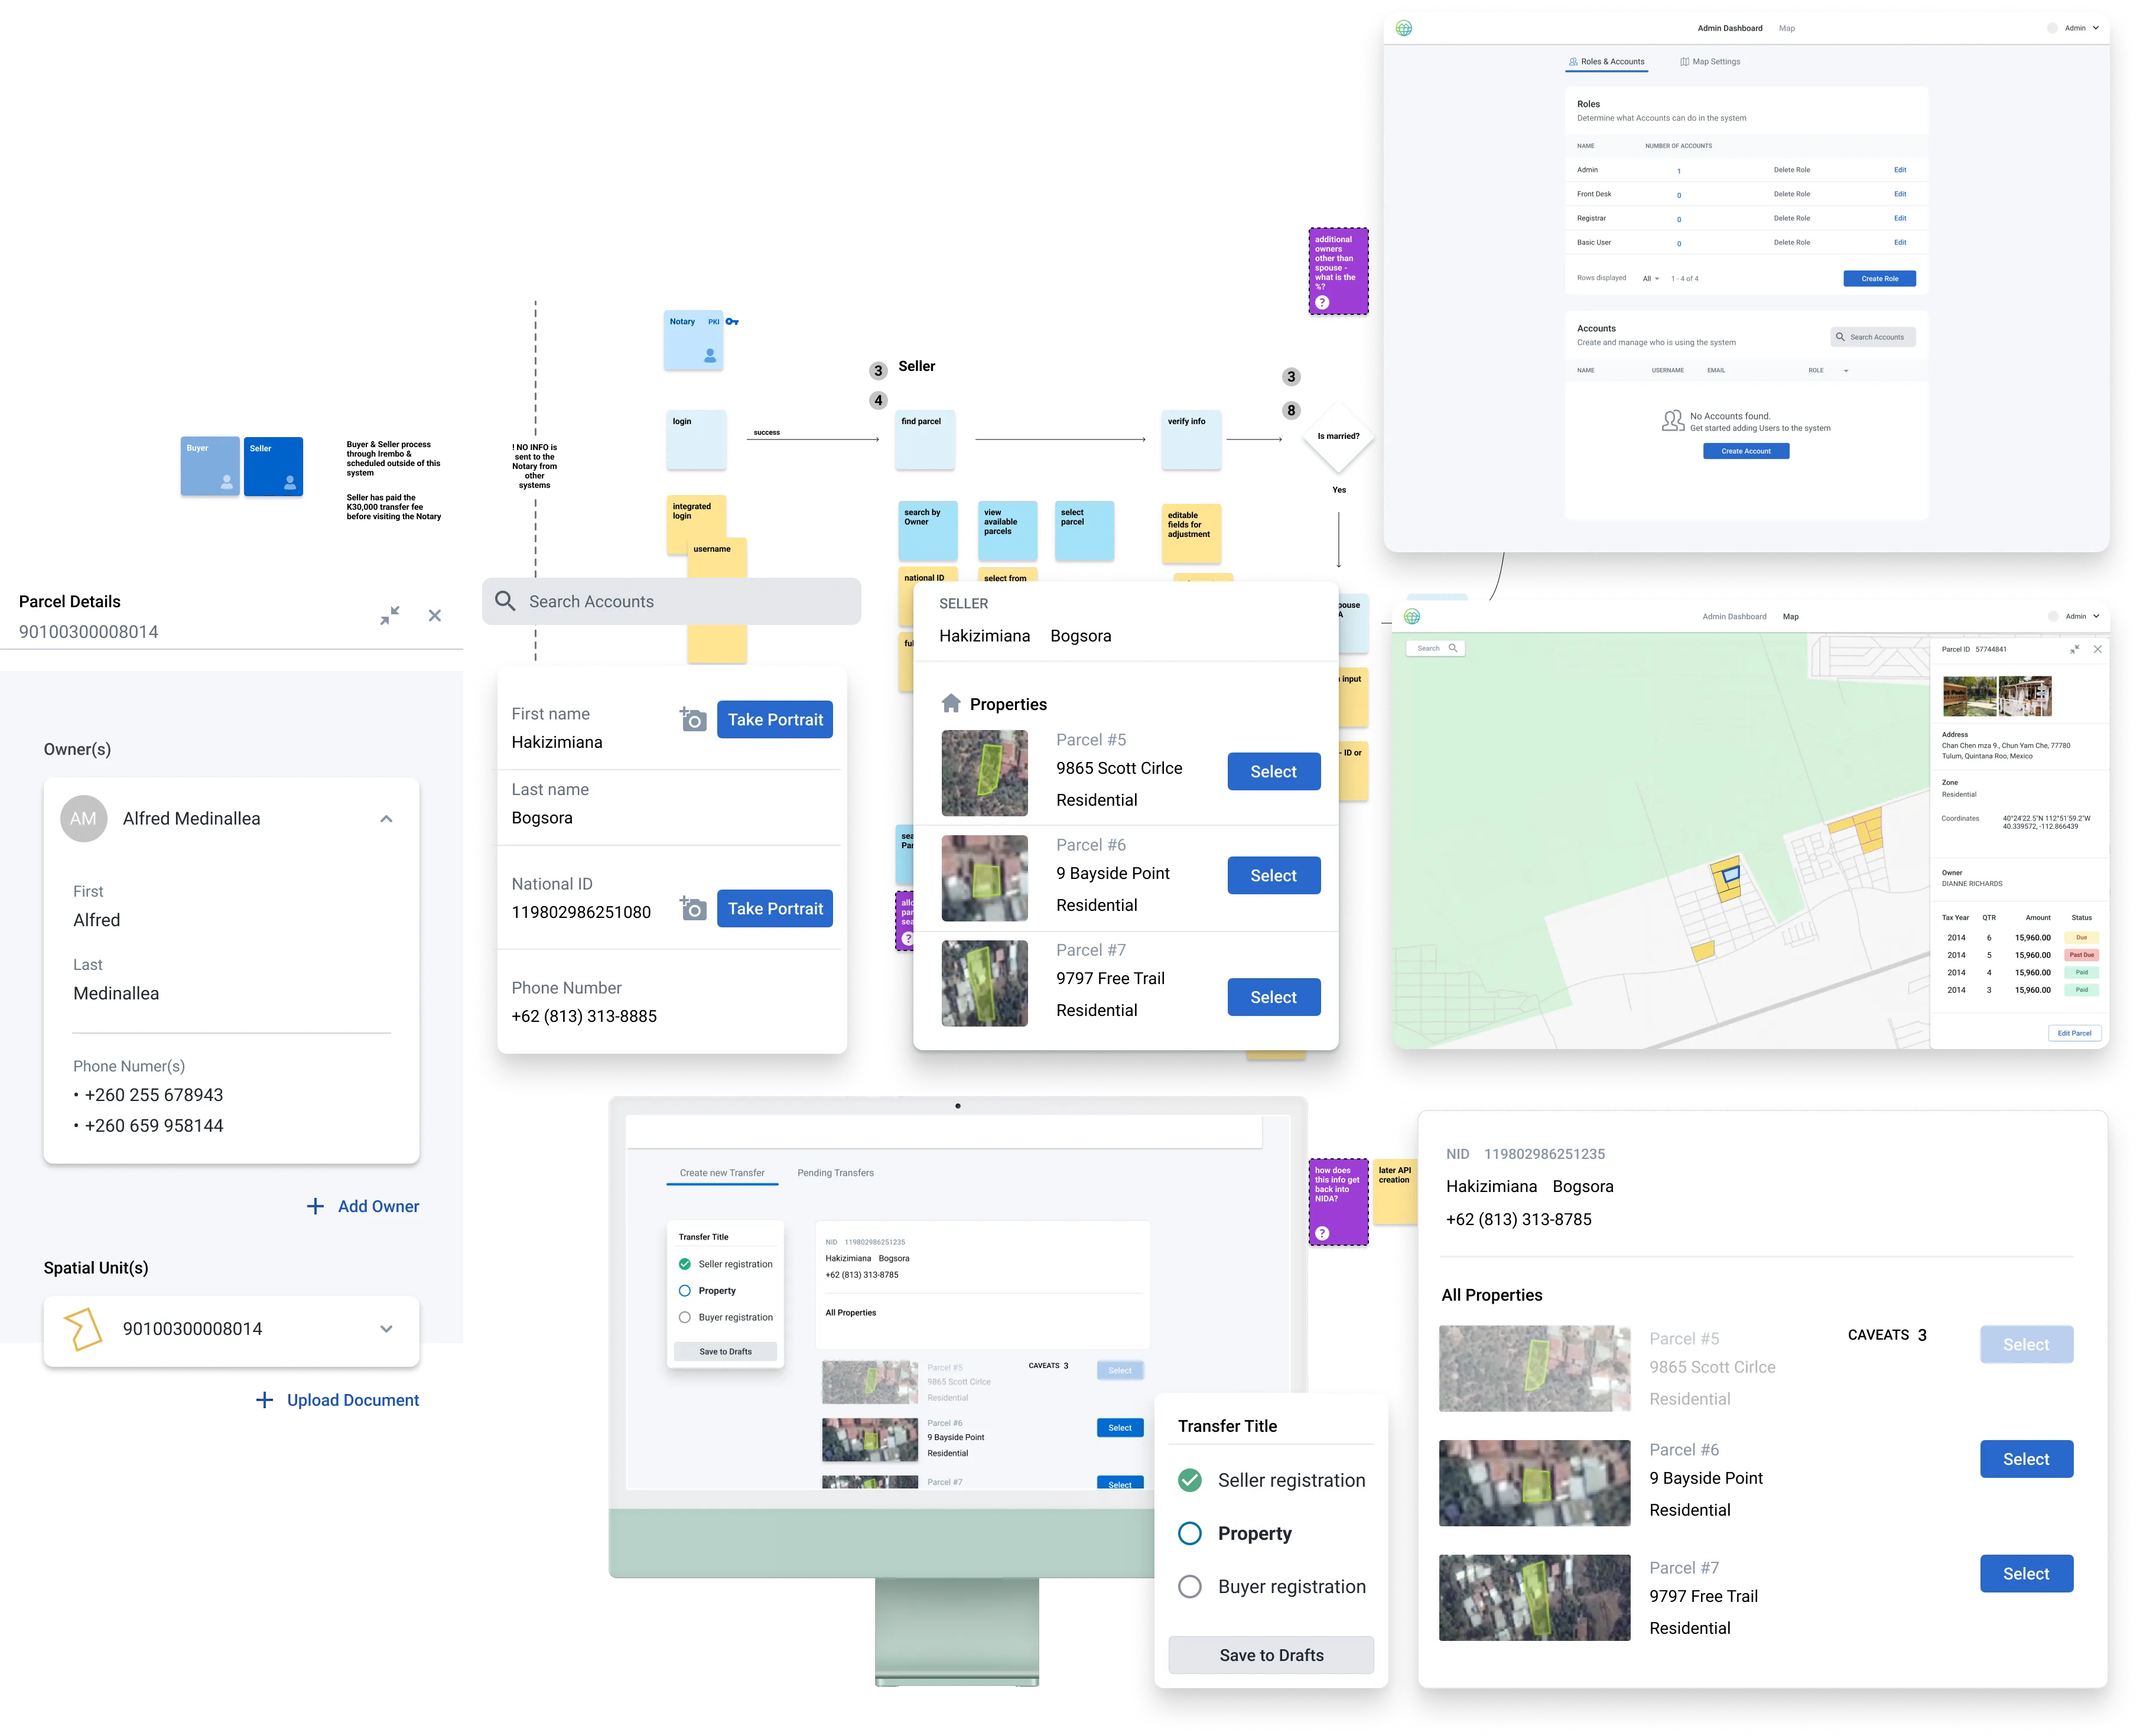
Collaborative Design Sprint
I facilitated a 5-day design sprint to rapidly build team consensus and create a functional prototype. This process established detailed user personas, clarified core user tasks, and led to a cohesive vision for our complex land administration system.
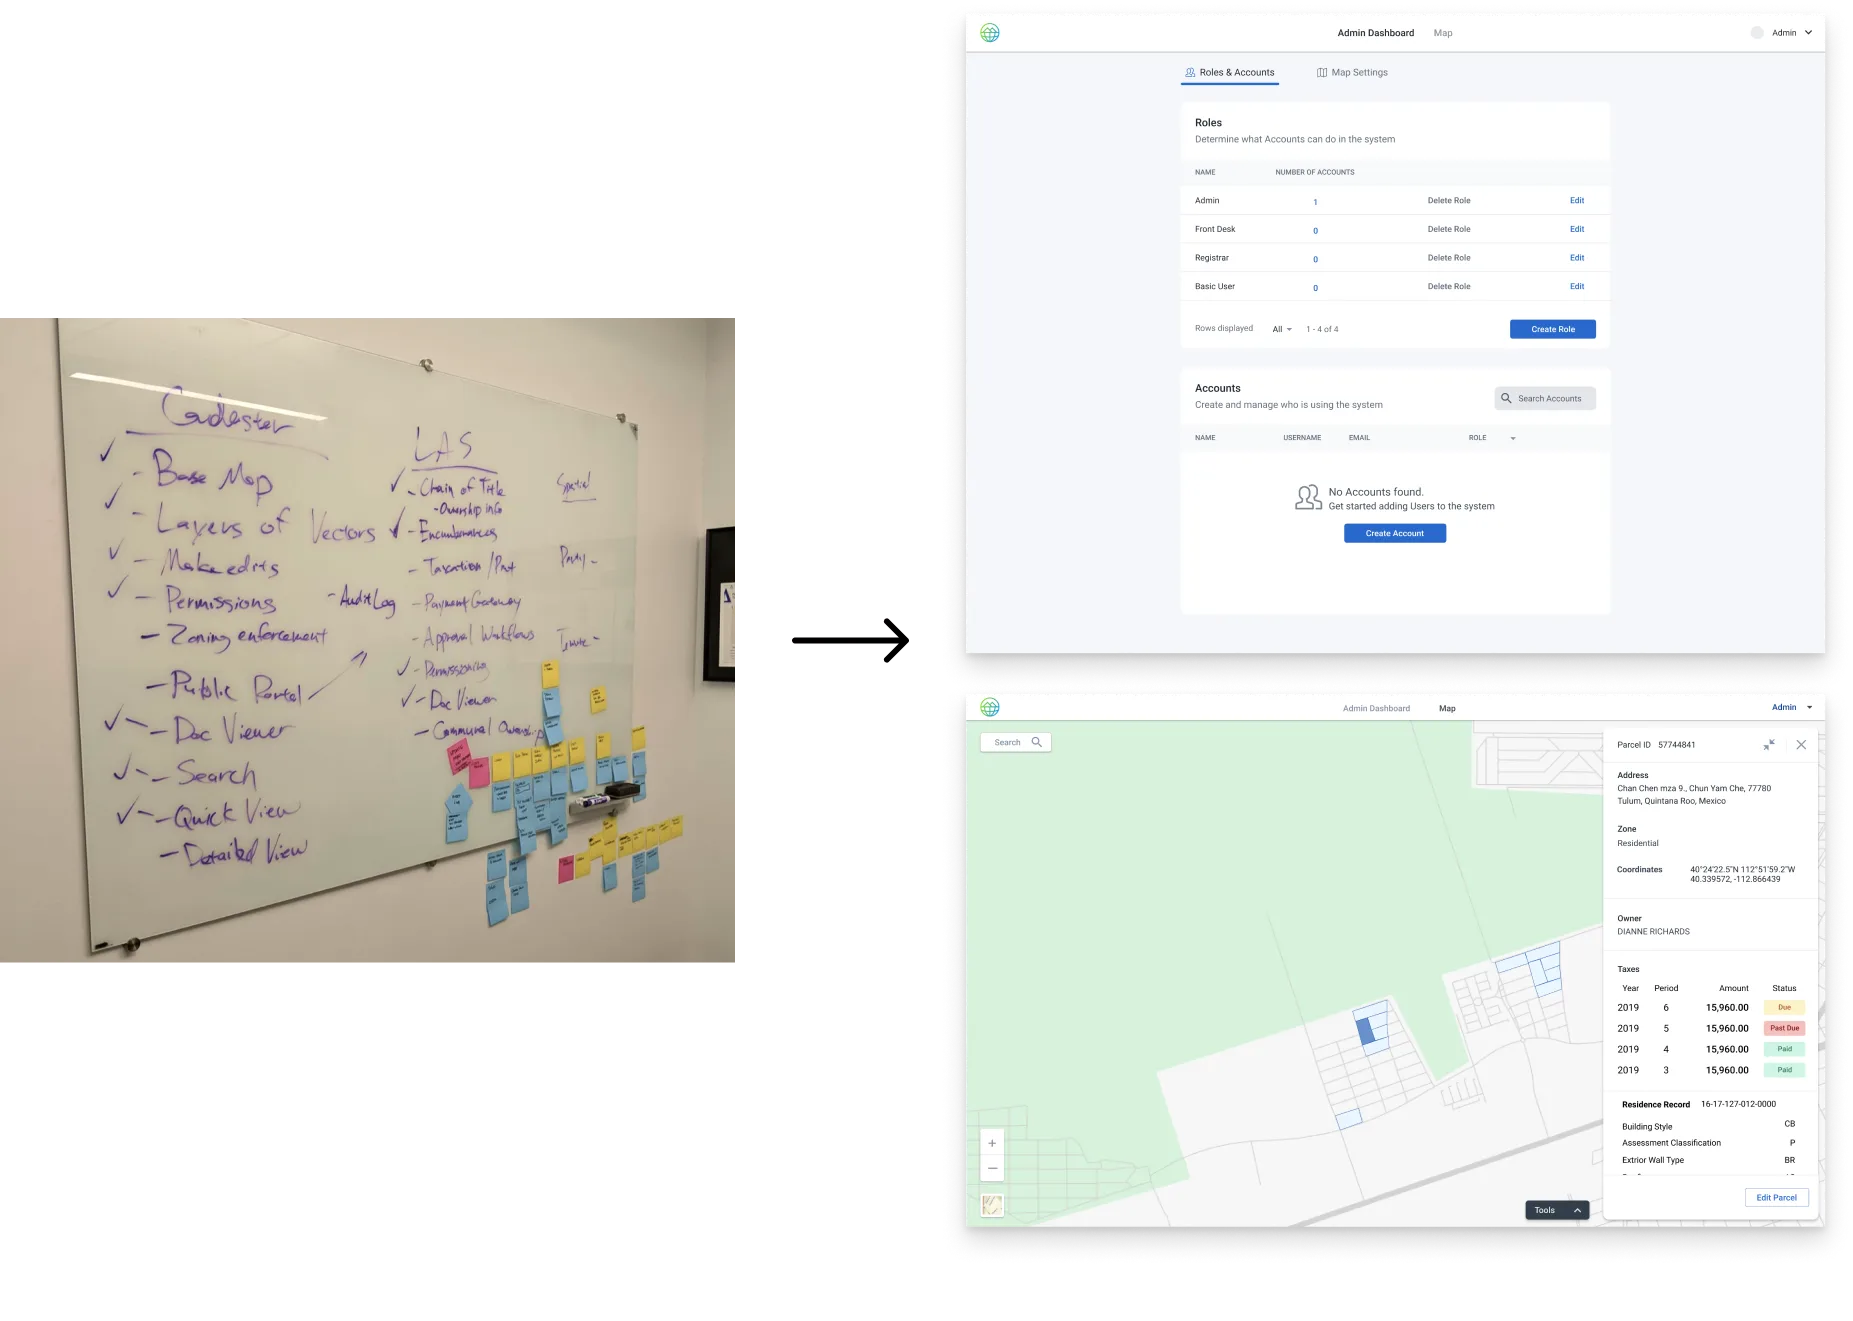
User story mapping + low-fidelity prototype
Technical Approach Simplified
Our approach centered on essential user interactions such as search functionality and efficient data visualization, prioritizing usability and system efficiency.
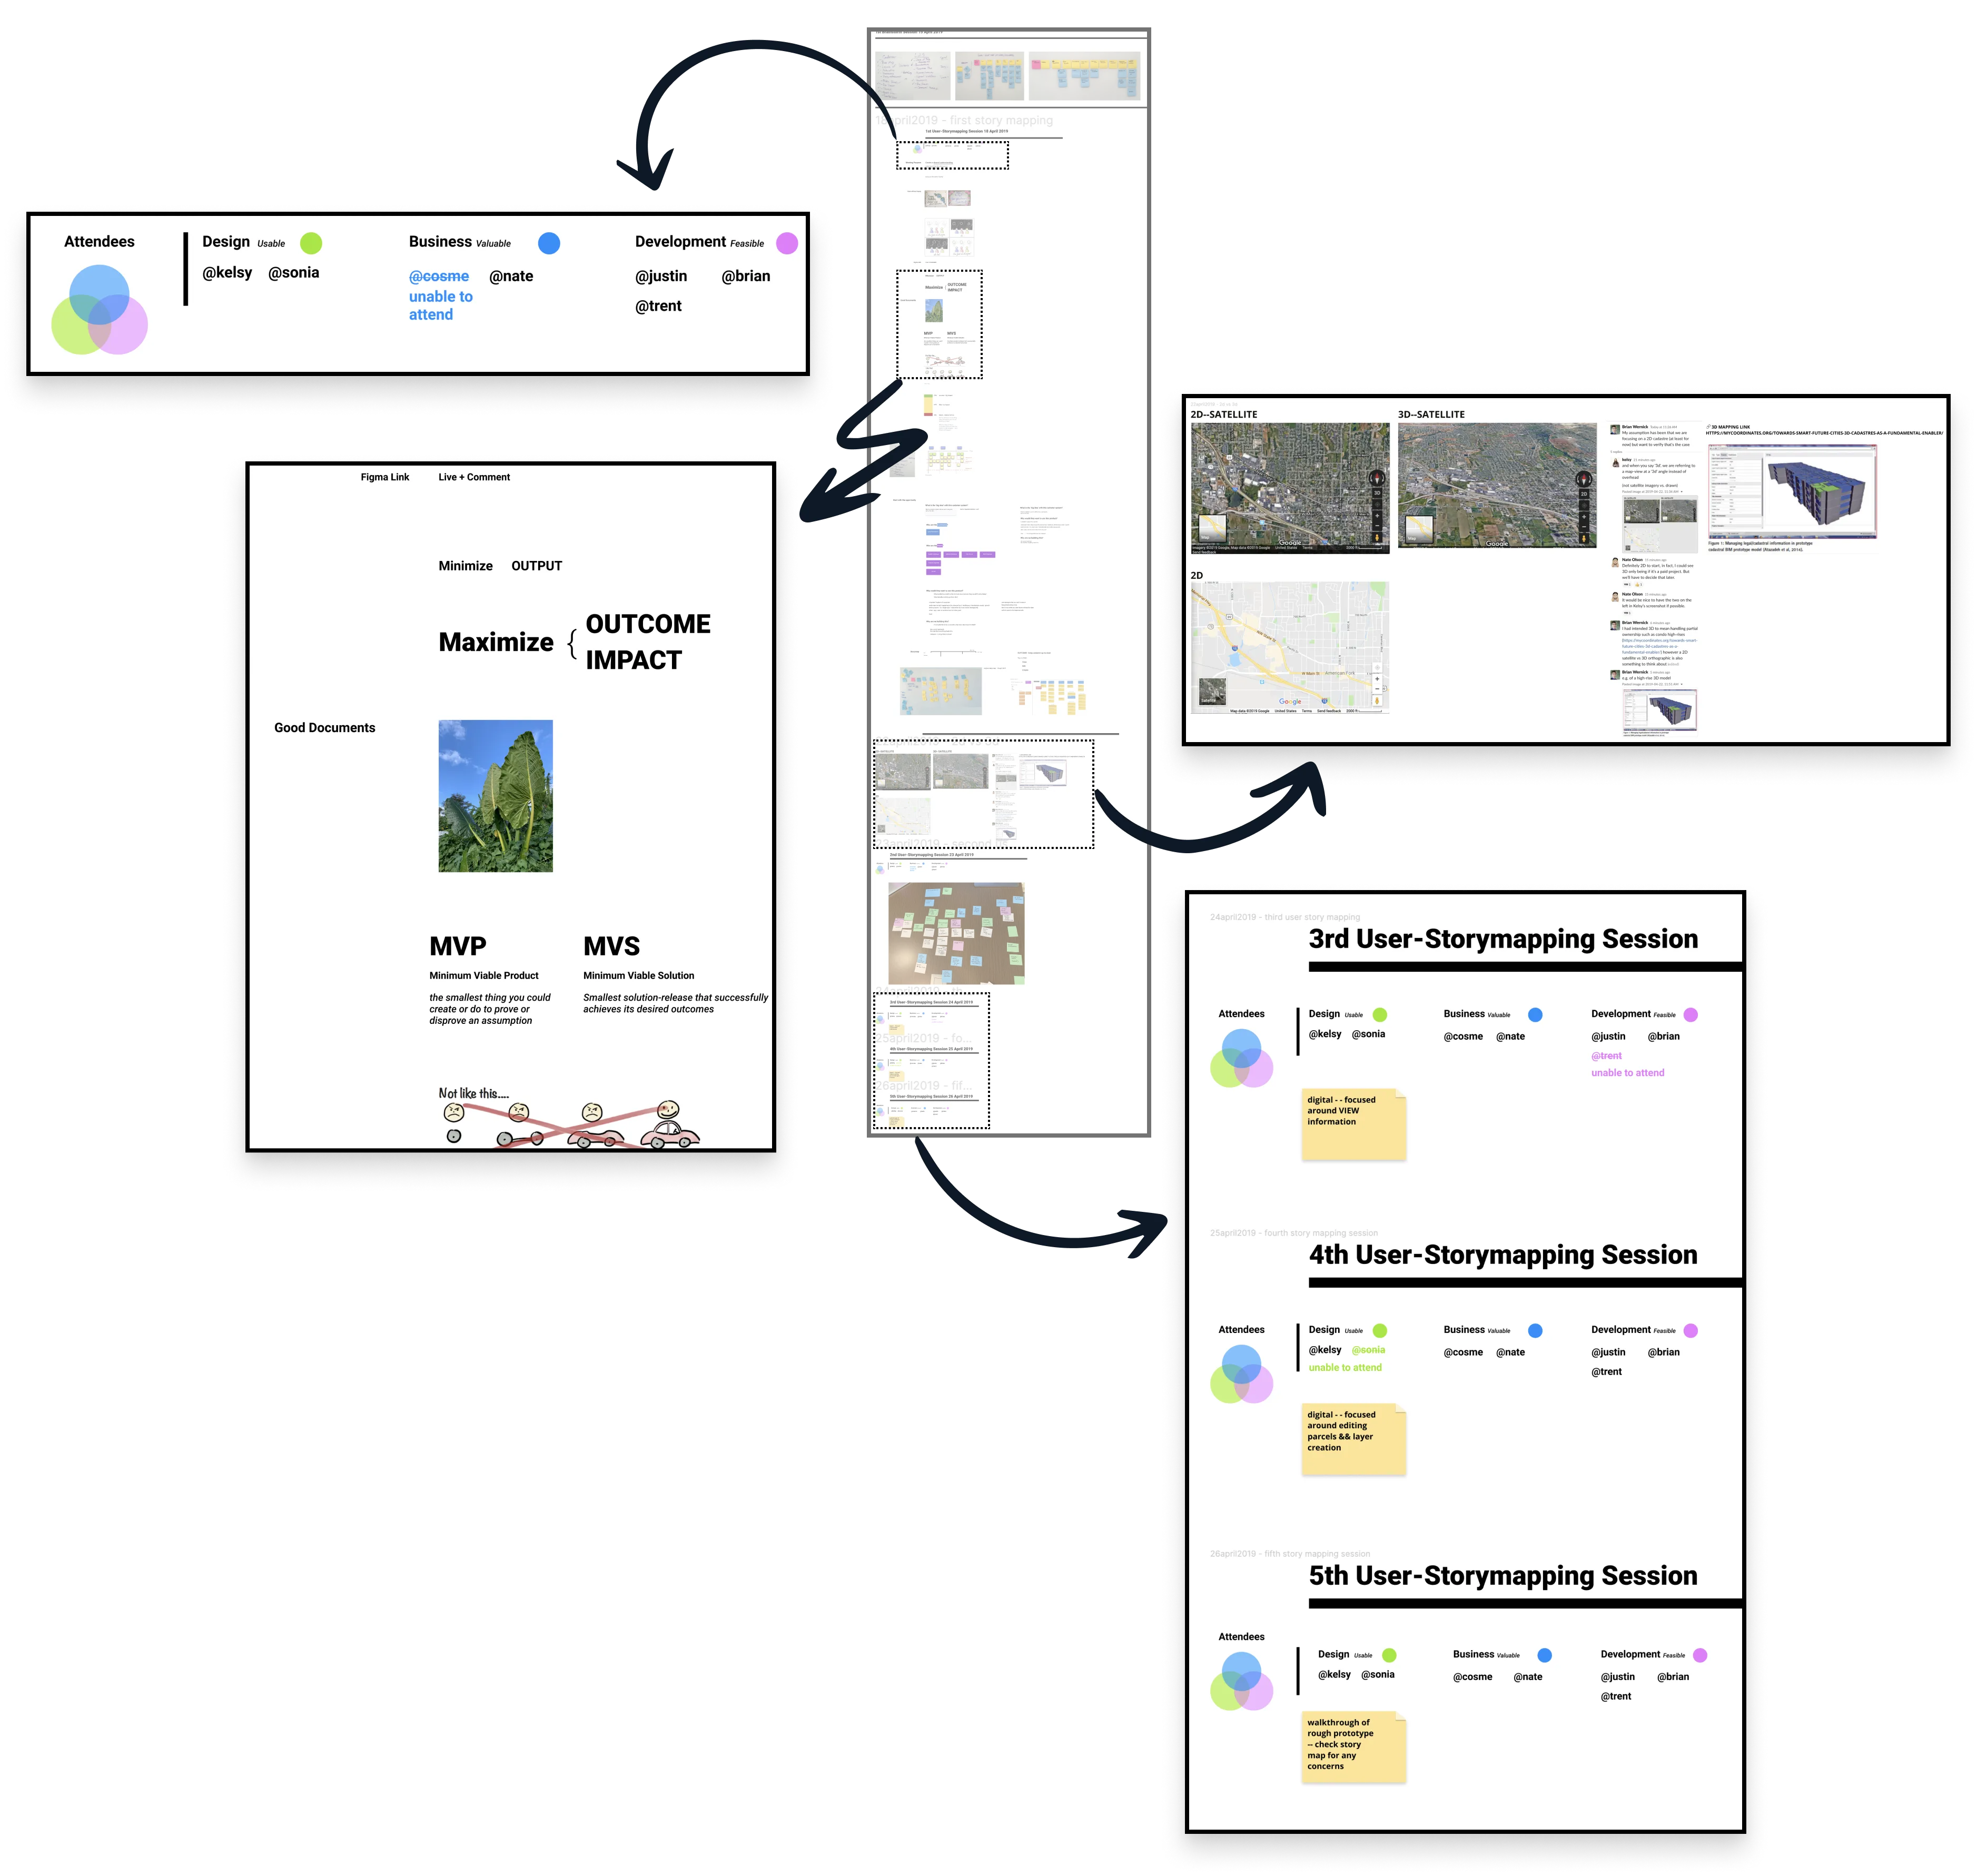
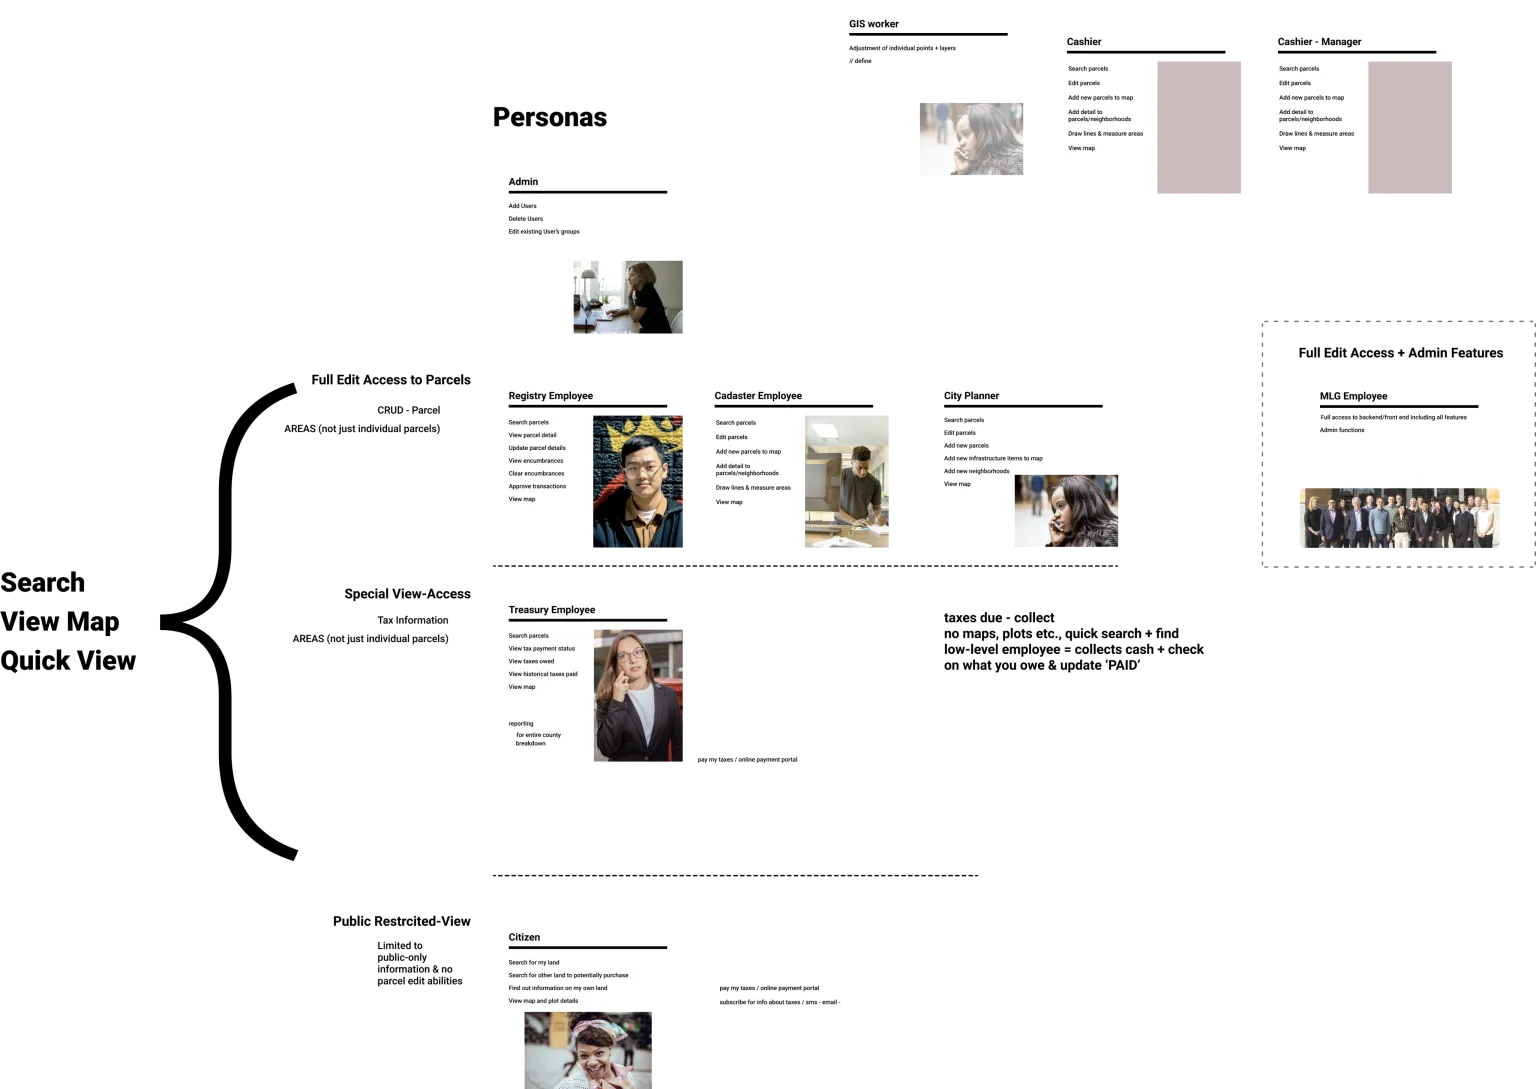
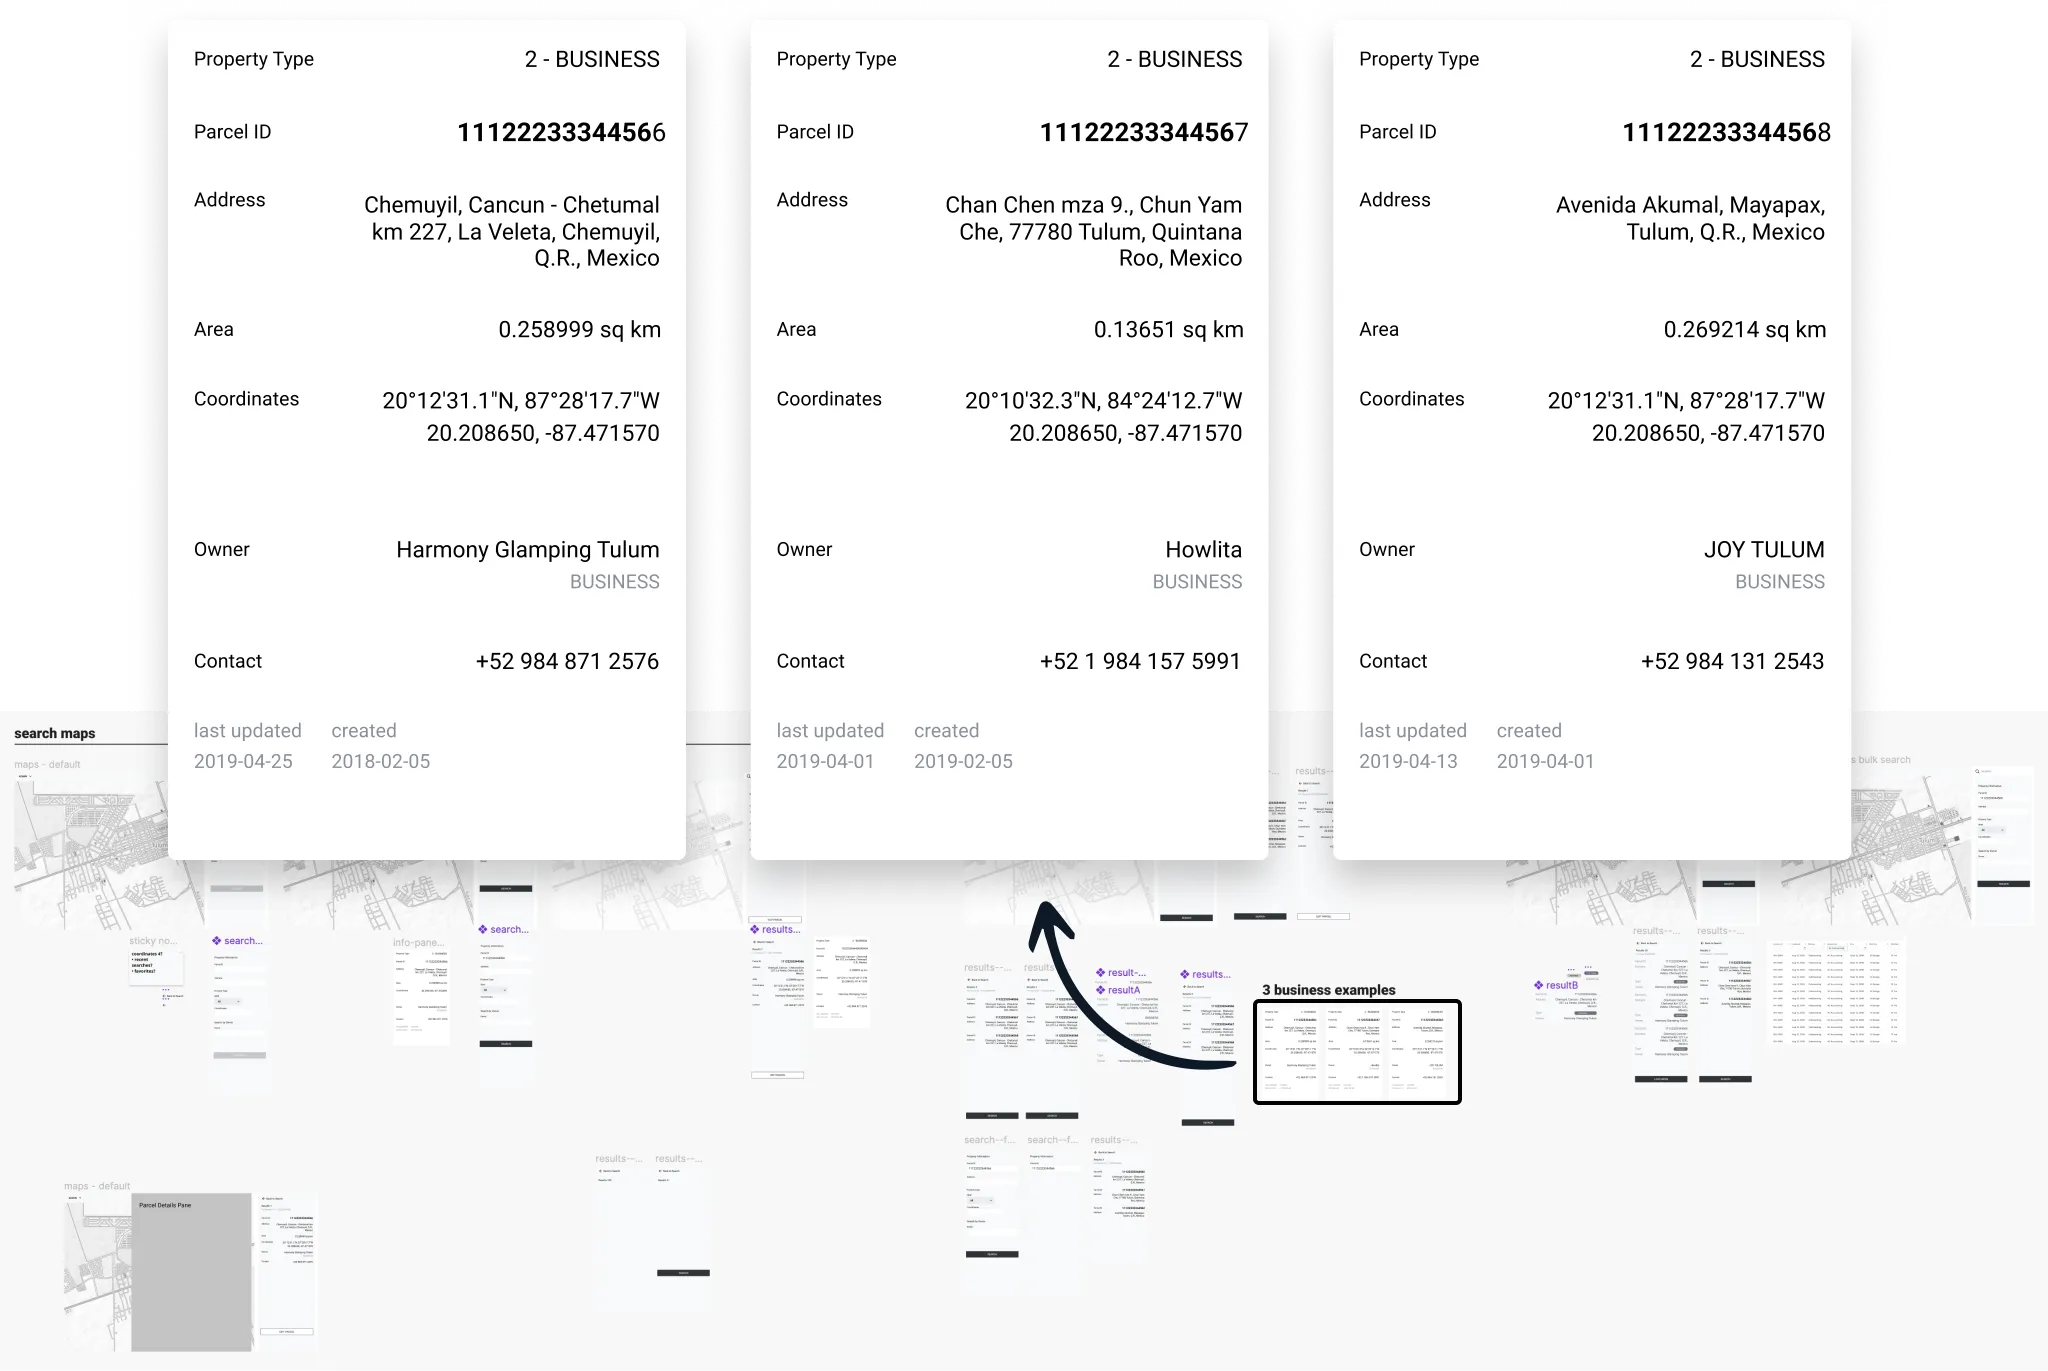
Our initial release had to support three key user behaviors:
- Searching: (locating a person or a parcel-record within the system)
- Viewing the map: a crucial component of the land-administration experience
- Quick view: providing a glimpse of summary information without the need to pull up the full record
Our first end-to-end prototype
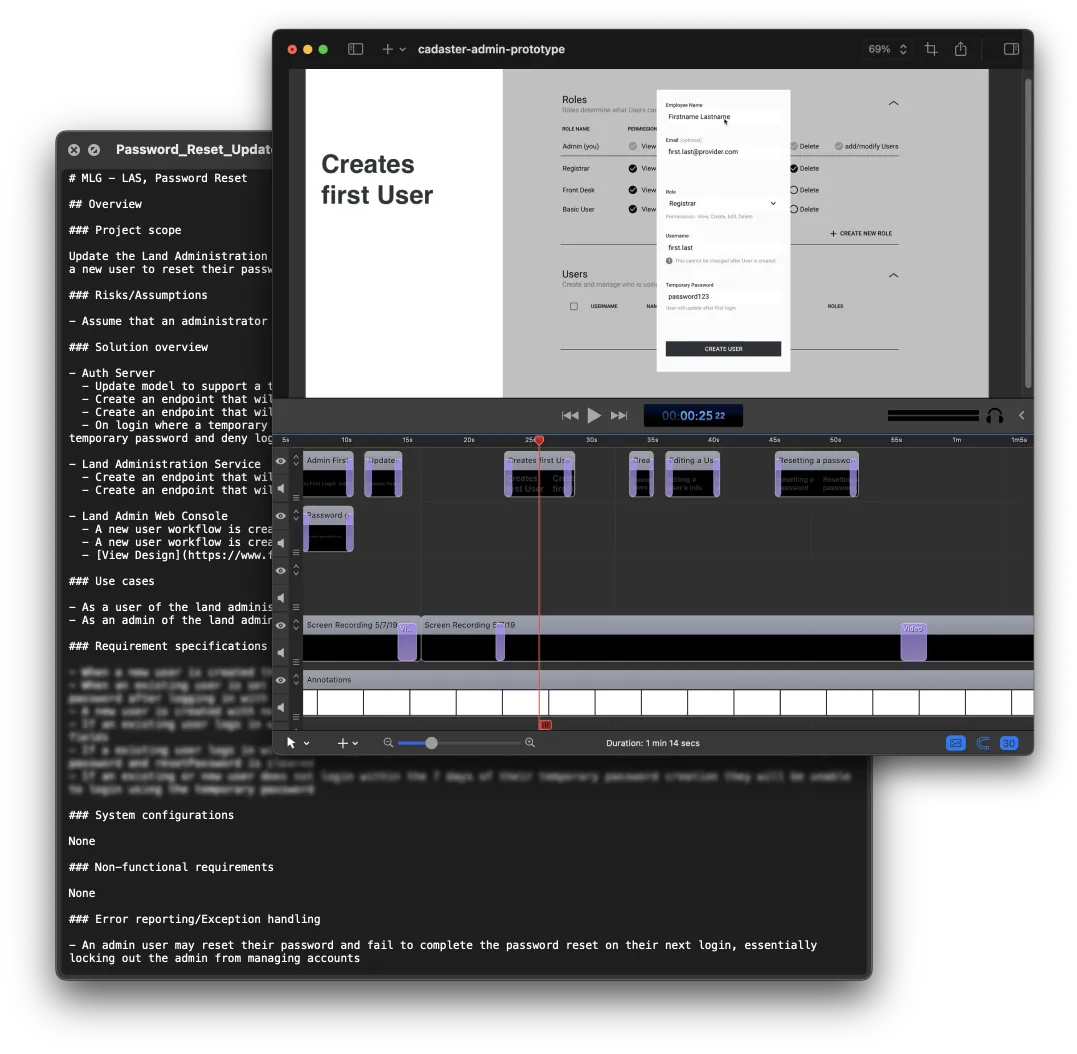
The end of day 05 was the presentation of the low fidelity functional prototype walkthrough.
My confidence was up because I was sure that we had the end-to-end experience & all of the major touchpoints identified by the people building the product (PM, UX, DEV).
The video contains text because I wanted this artifact to be able to be played and still convey context without sound. Overall, the presentation went great and there were no major gaps/concerns in the prototype (now people just wanted to see it in higher fidelity).
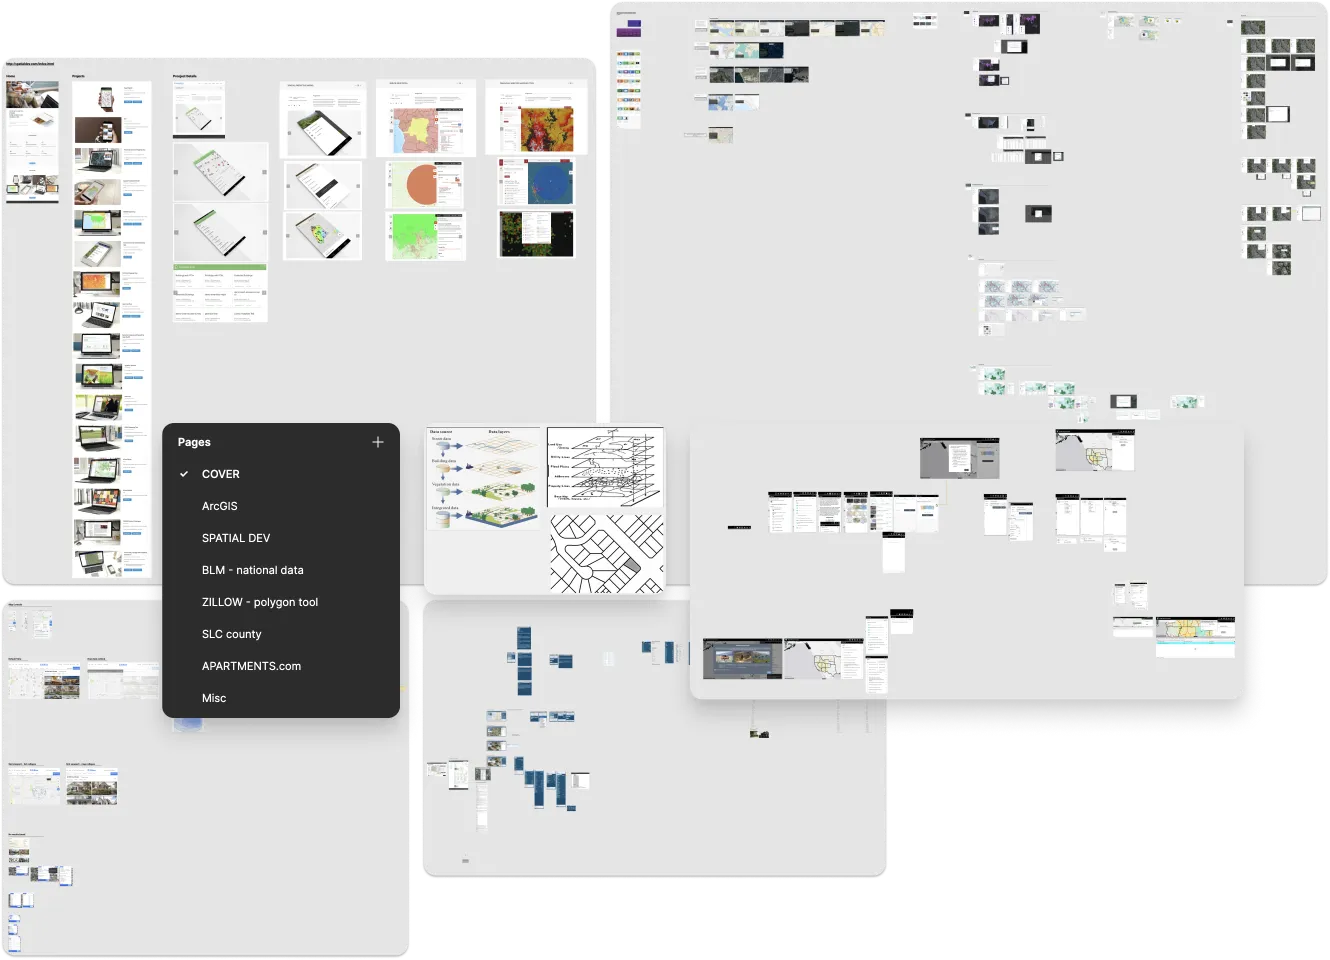
Absorbing patterns & soaking in .pdfs
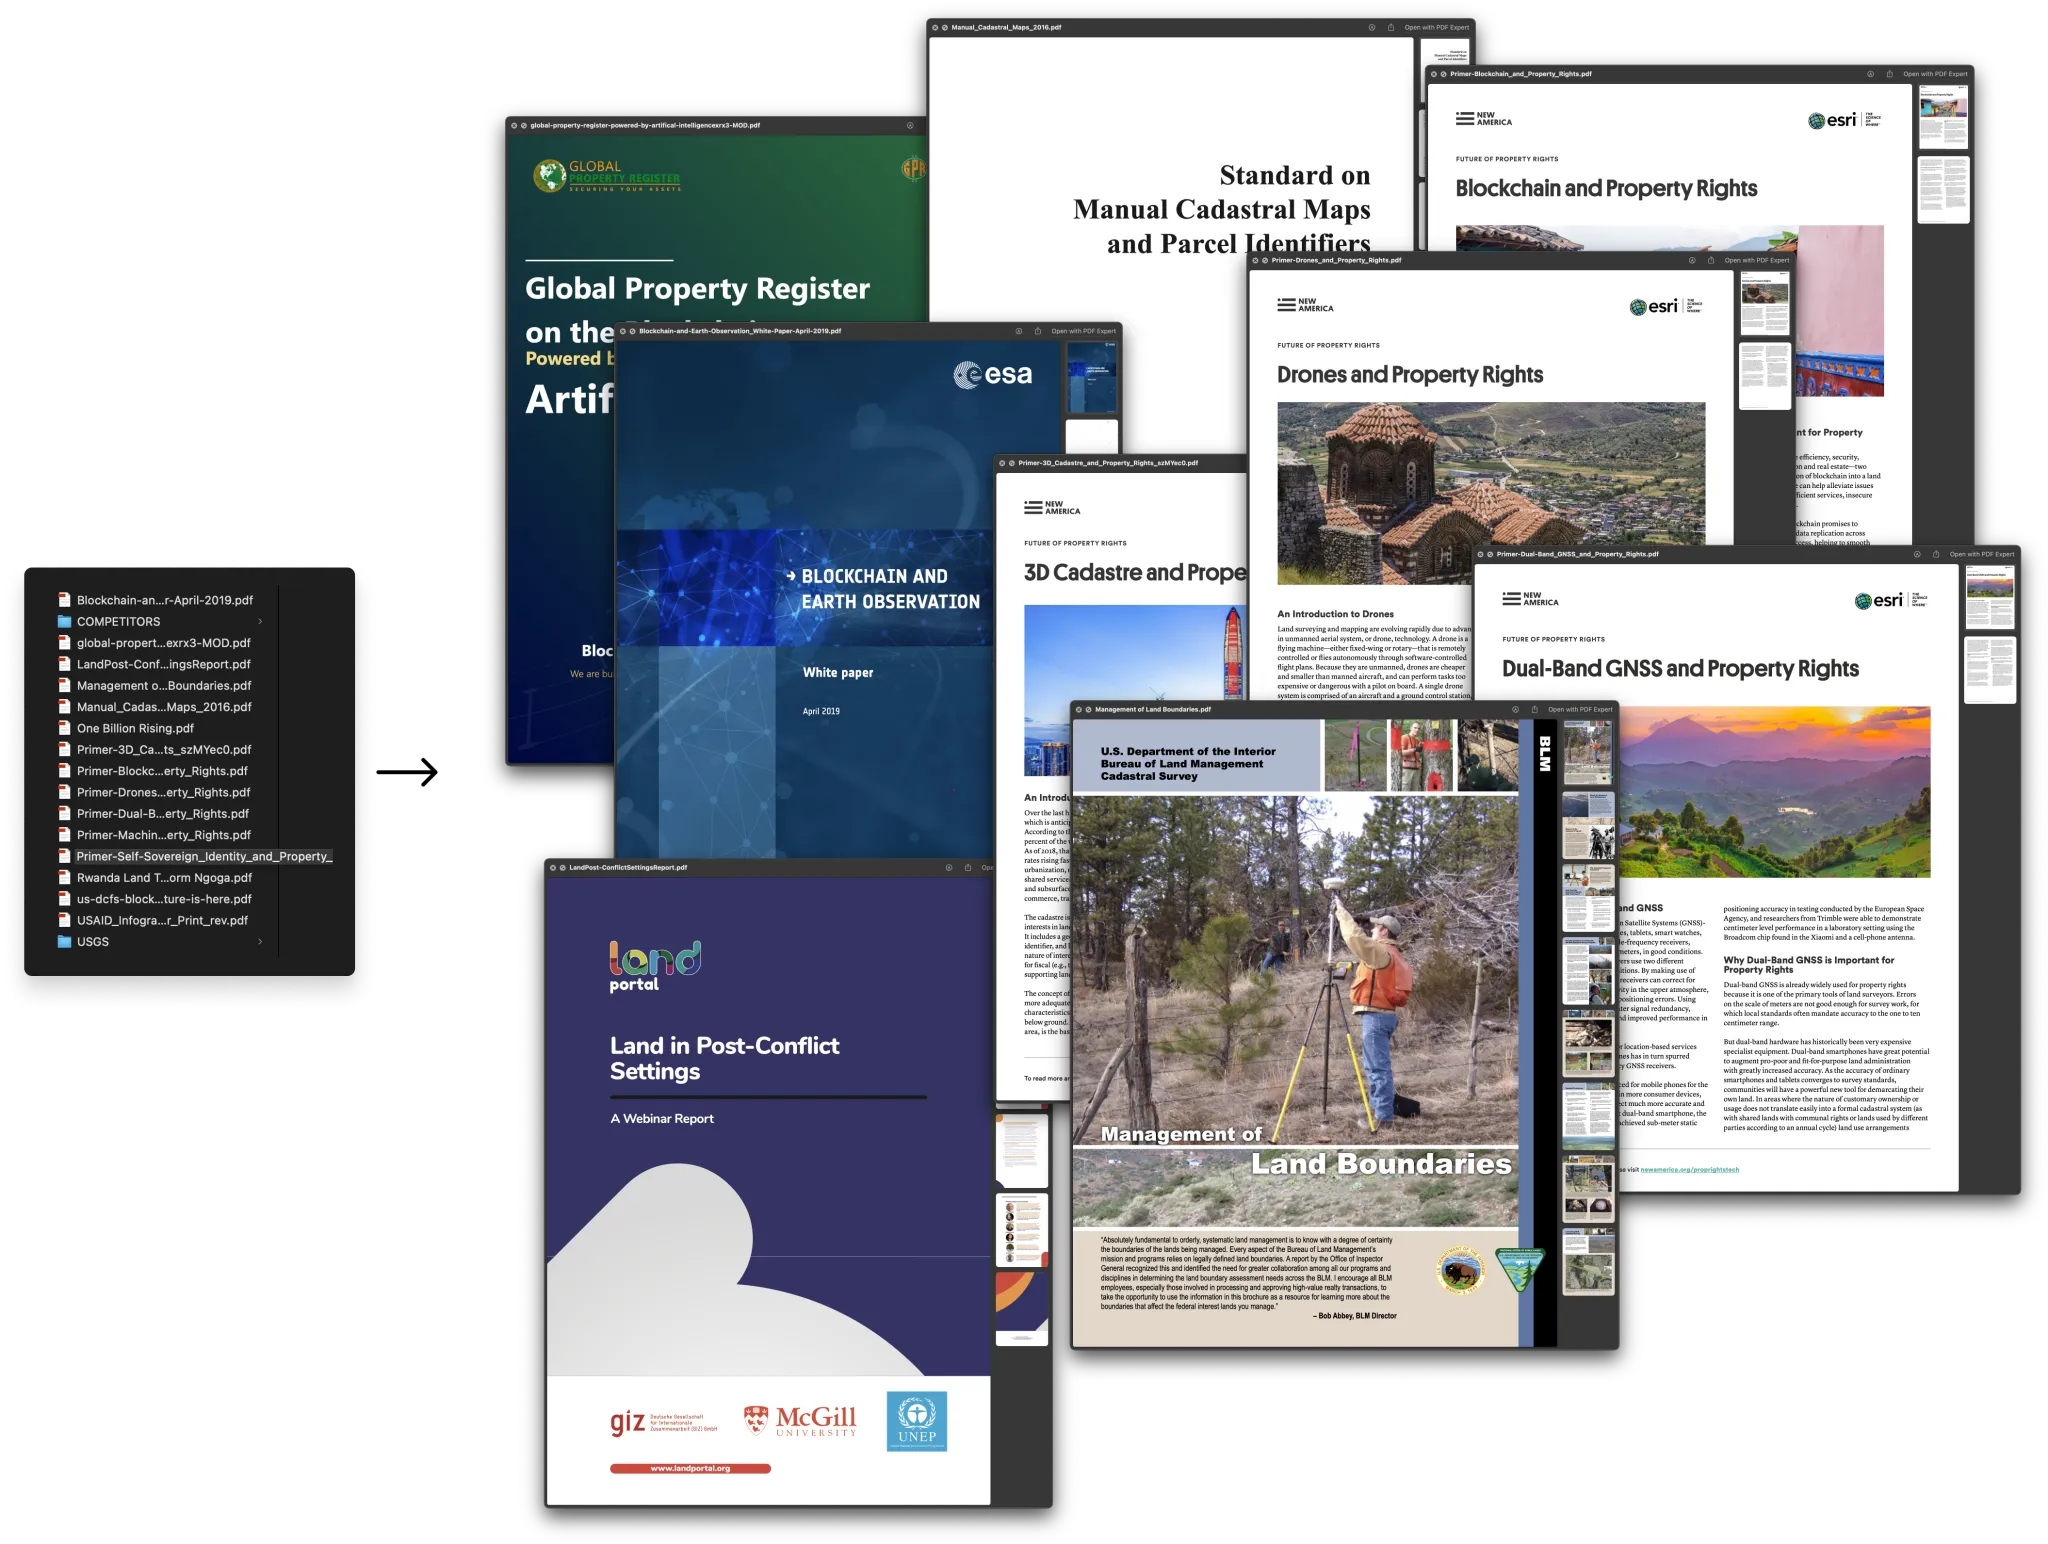
There was a lot of research that I was doing in the background leading up to the story mapping sessions, and throughout my time there.
New info would come up during a session that would help guide my study-time.
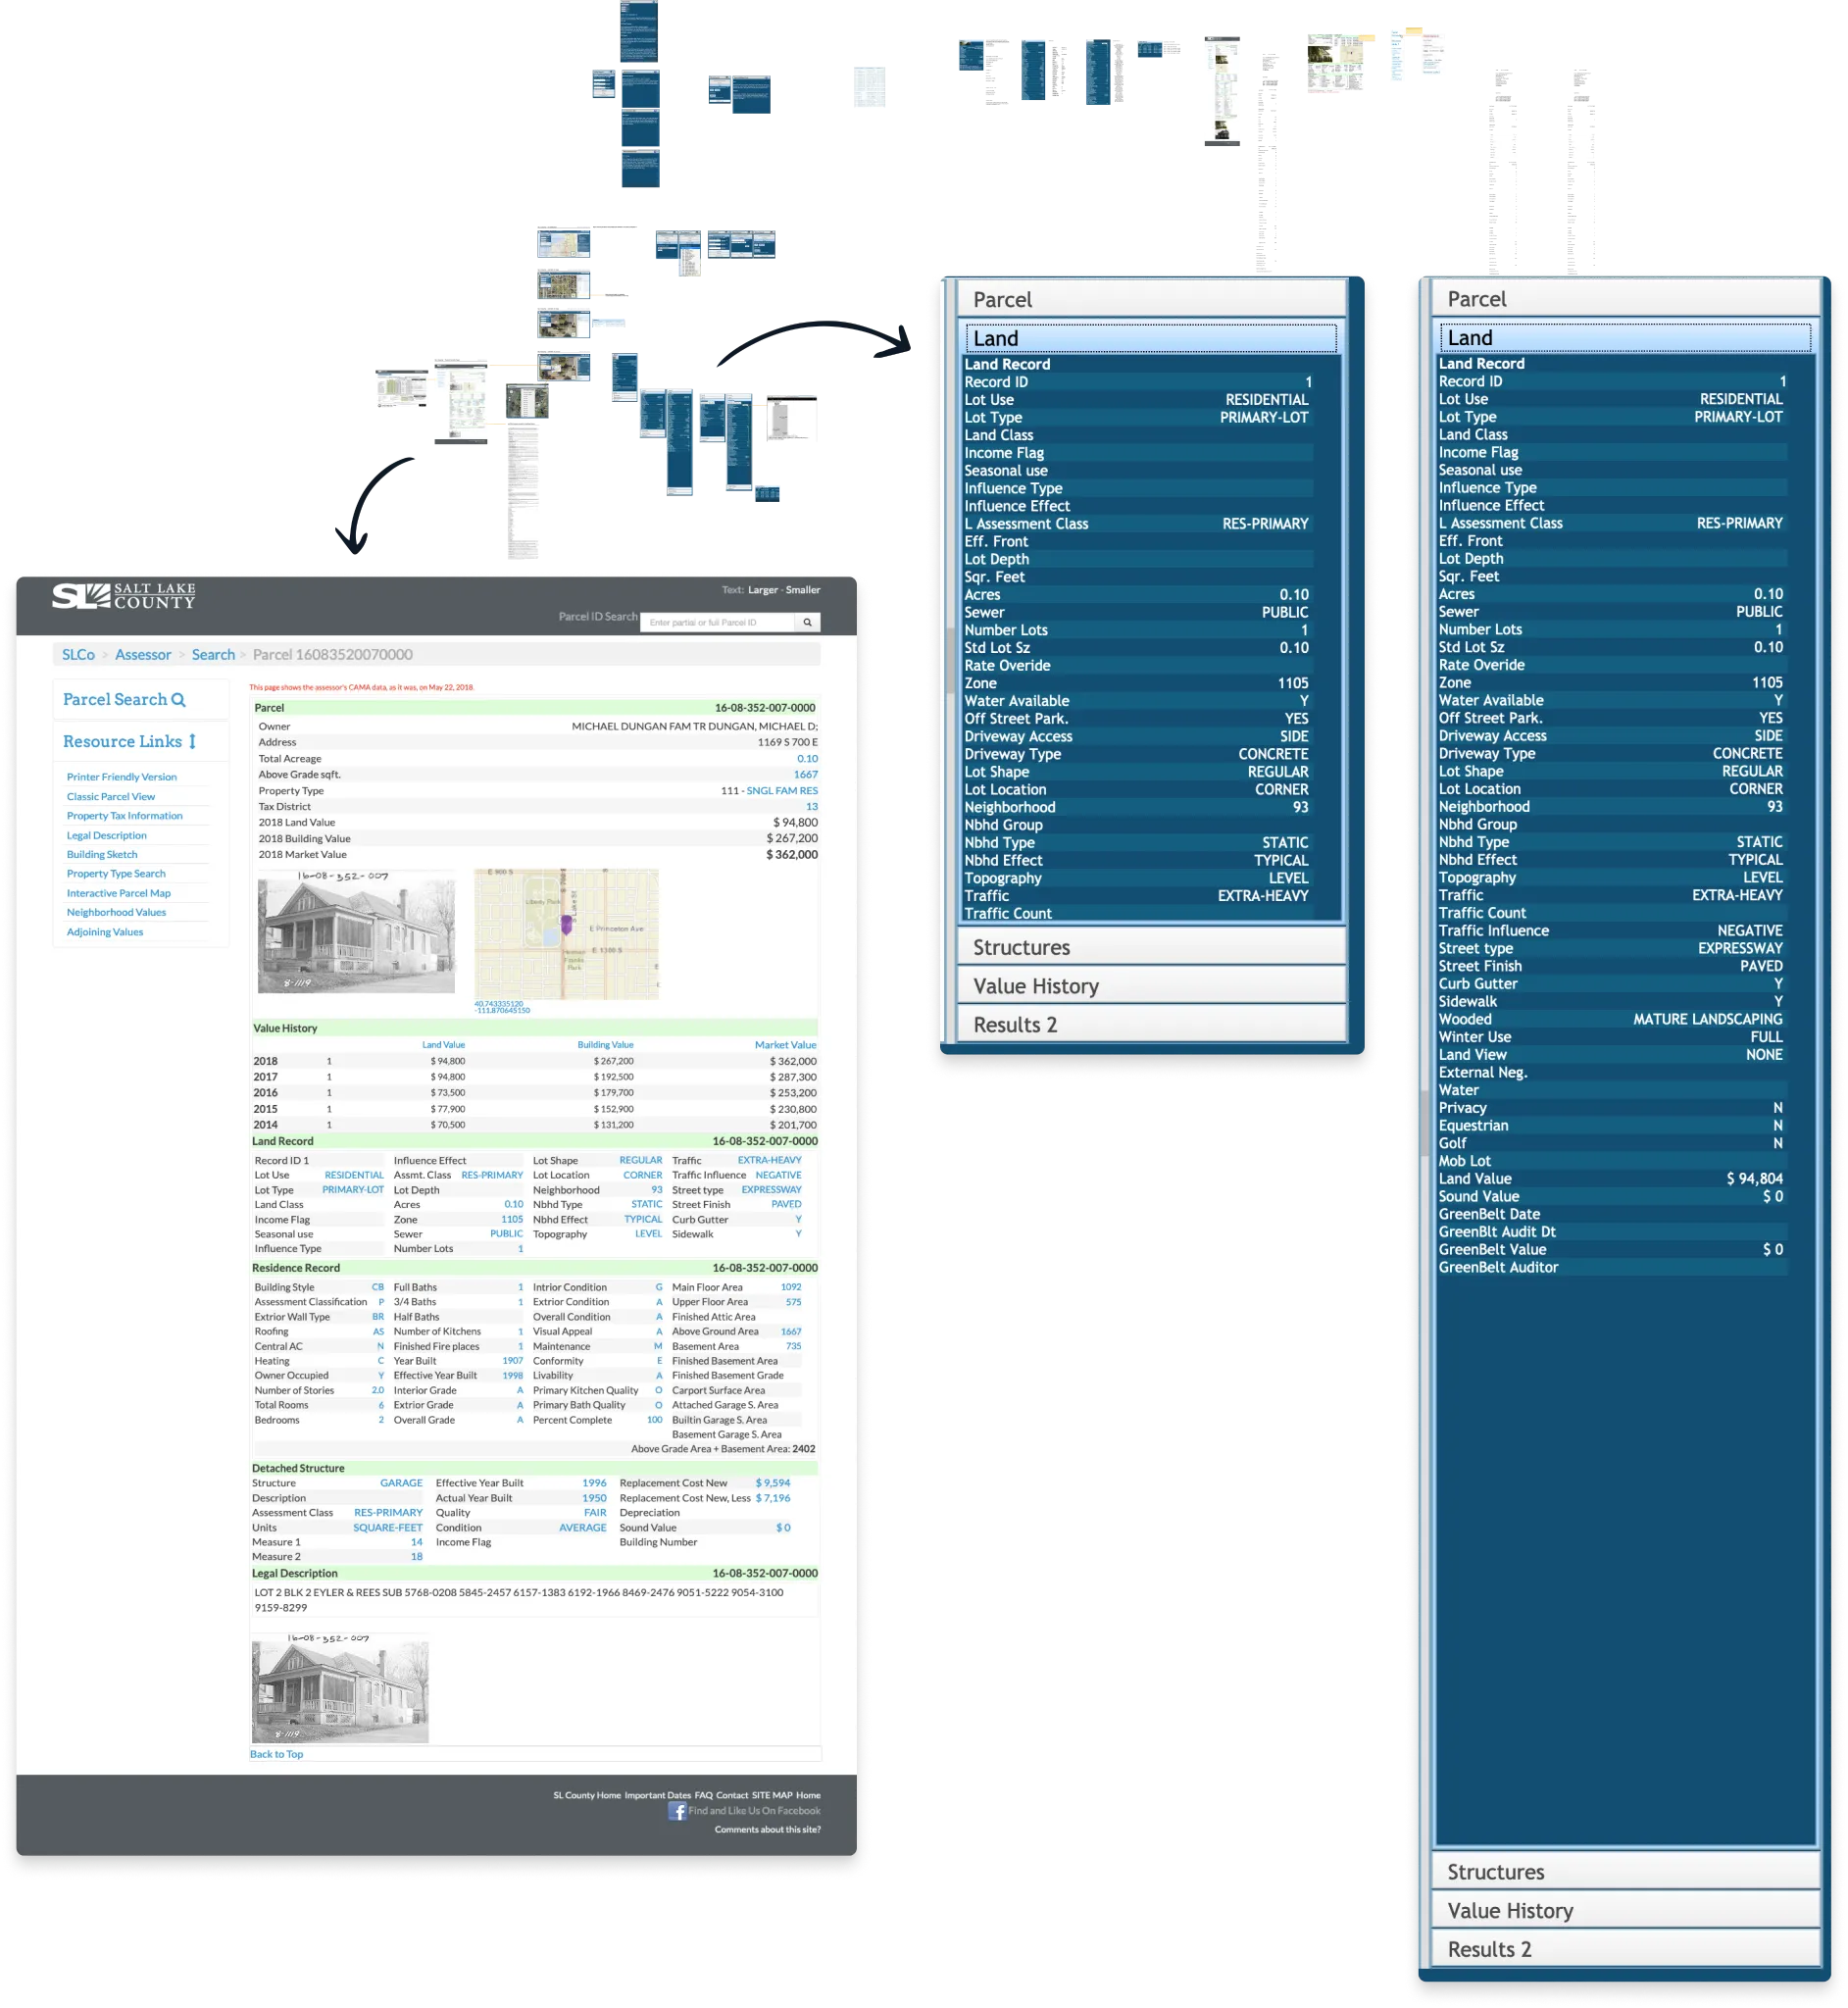
This system was responsible for is handling a lot of information, usually in something that could look like a huge spreadsheet.
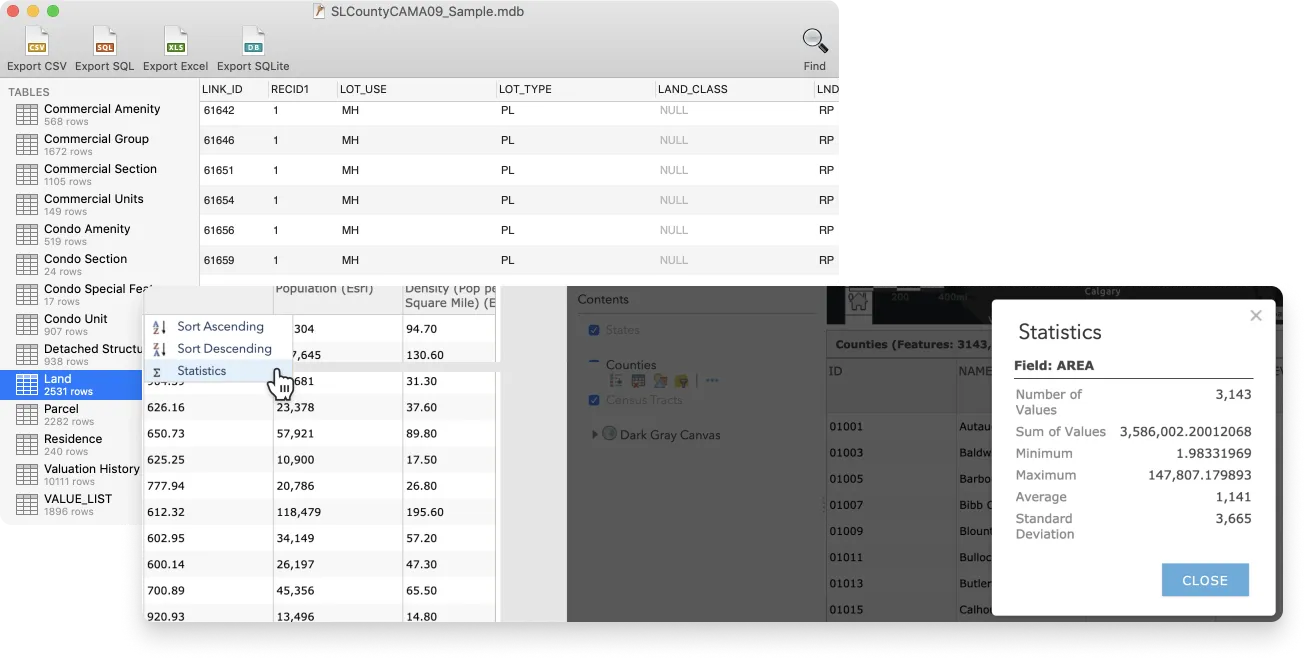
Spending time downloading and looking at public land records from around the U.S. helped me see what data points were common, and got the wheels turning for how we might handle lots of information.
The underlying data was only one piece, there was the actual systems used by governments & GIS professionals that I started going through and capturing. It gave me an overall feel of what different experiences were like and what were some common broad-patterns shared between them.
The shoulders of giants
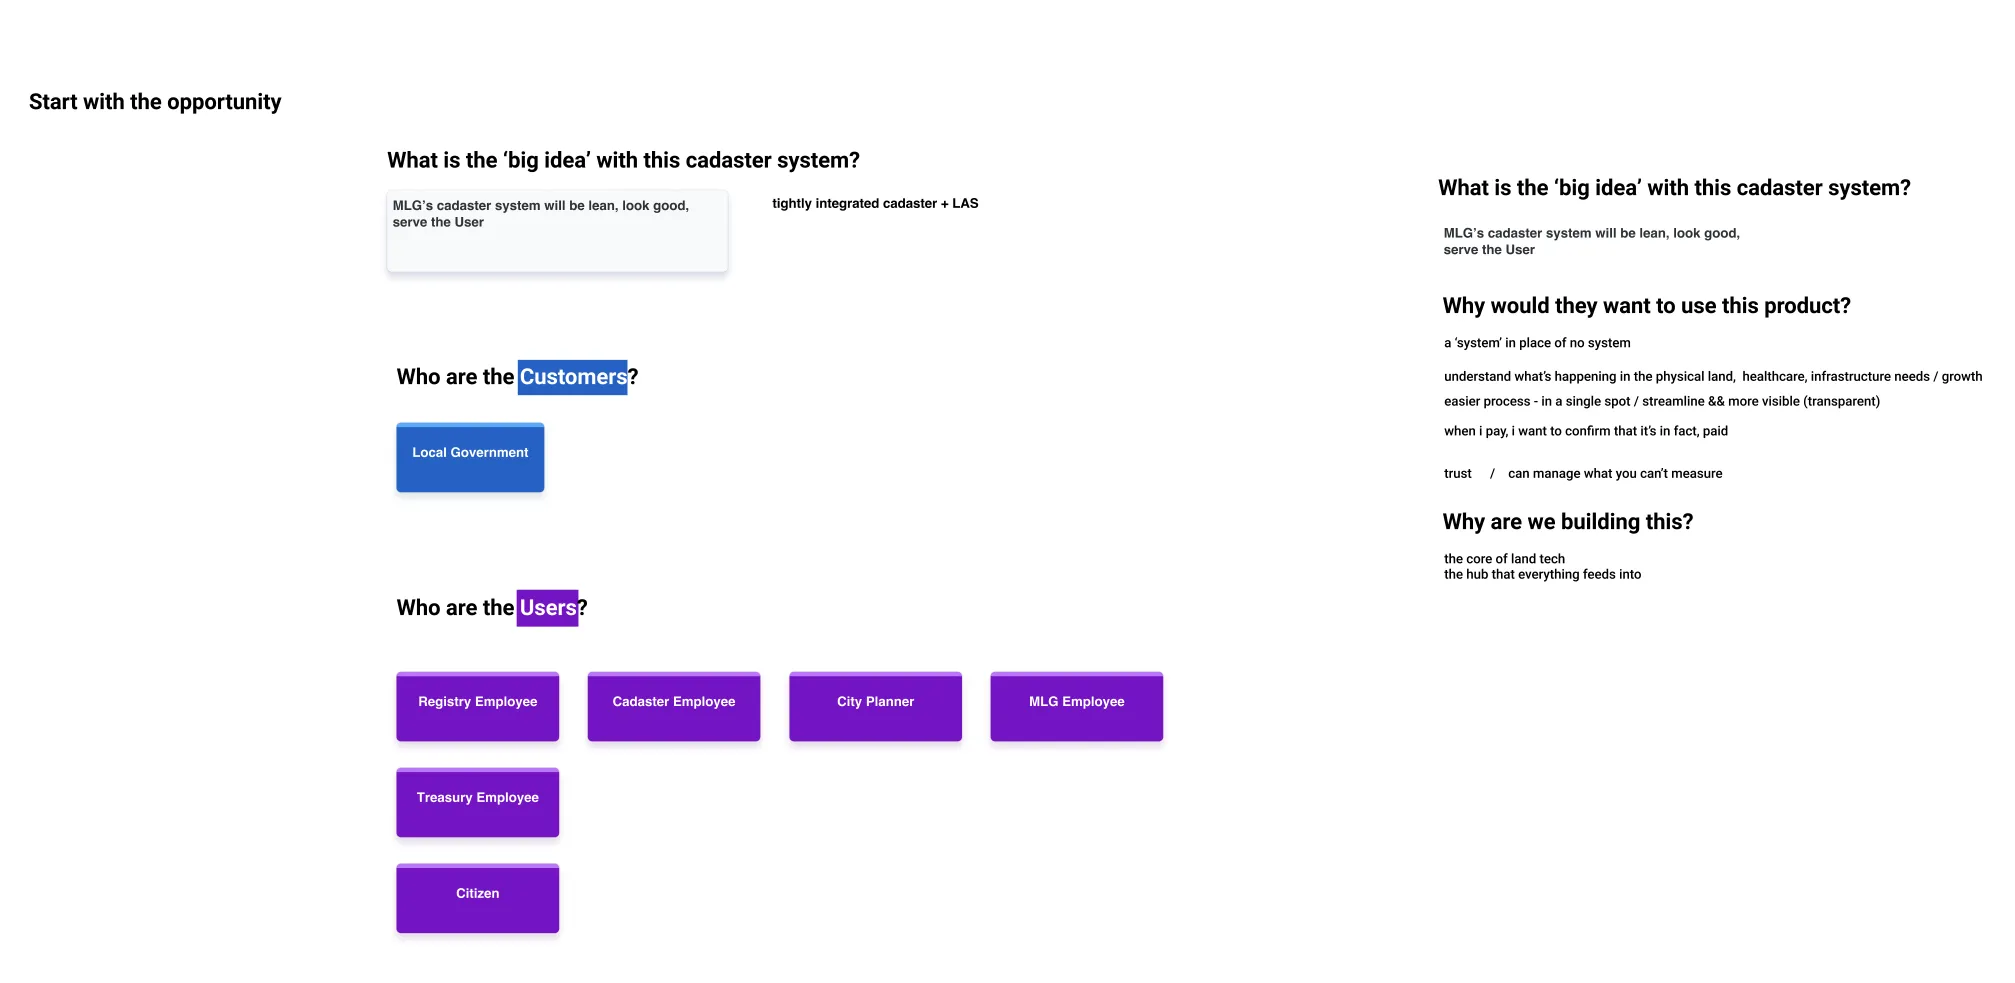
The fact that my experience was great at MLG had a lot to do with building shared understanding quickly, and these are the bulk of the techniques/concepts that were pulled from.
With User Story Mapping + JTBD framing, we aligned around a cohesive product vision (at least an end-to-end functional flow).
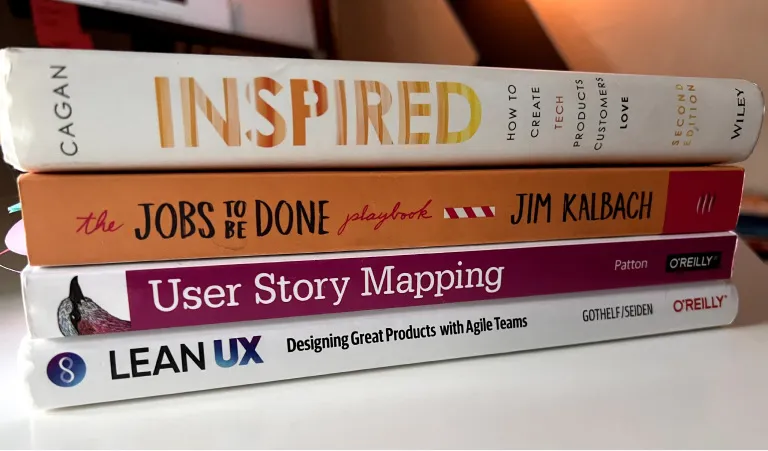
Here's some videos (youtube) to give you a high-level idea of the concepts .
- User Story Mapping with Jeff Patton (external link)
- Marty Cagan - The Nature of Product (external link)
- Jobs To Be Done for Product Management with Jim Kalbach (external link)
- Jeff Gothelf and Josh Seiden on Lean UX 3rd Edition at Lean Product Meetup (external link)
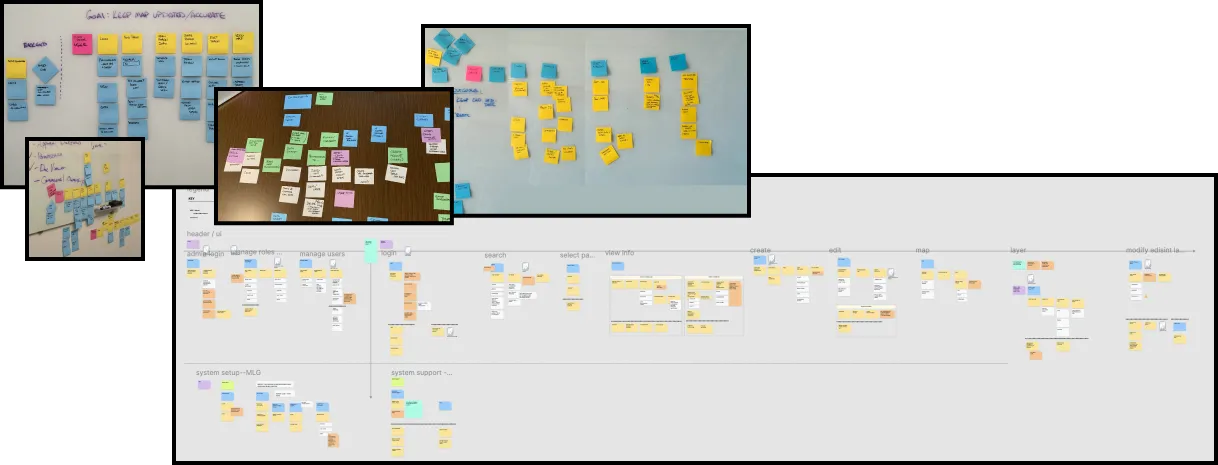
Continue to learn & build shared understanding
I’d reference that story map throughout my time at MLG, and we would kickoff new projects by having a quick mapping exercise to ensure alignment. With the functional end-to-end experience mapped out, it made it a lot easier to focus on getting the higher fidelity work done.
📼 view a time-lapse of higher fidelity exploration & prototyping
By leveraging components & systems-thinking from the beginning, making a decision around one piece of UI would ripple out to the rest of the system (e.g., the border-radius on the login modal would be the same as the table’s border-radius on the admin page).
When in doubt, get together with the people you're working with, externalize
assumptions & start building a shared understanding.
Best,
Kelsy